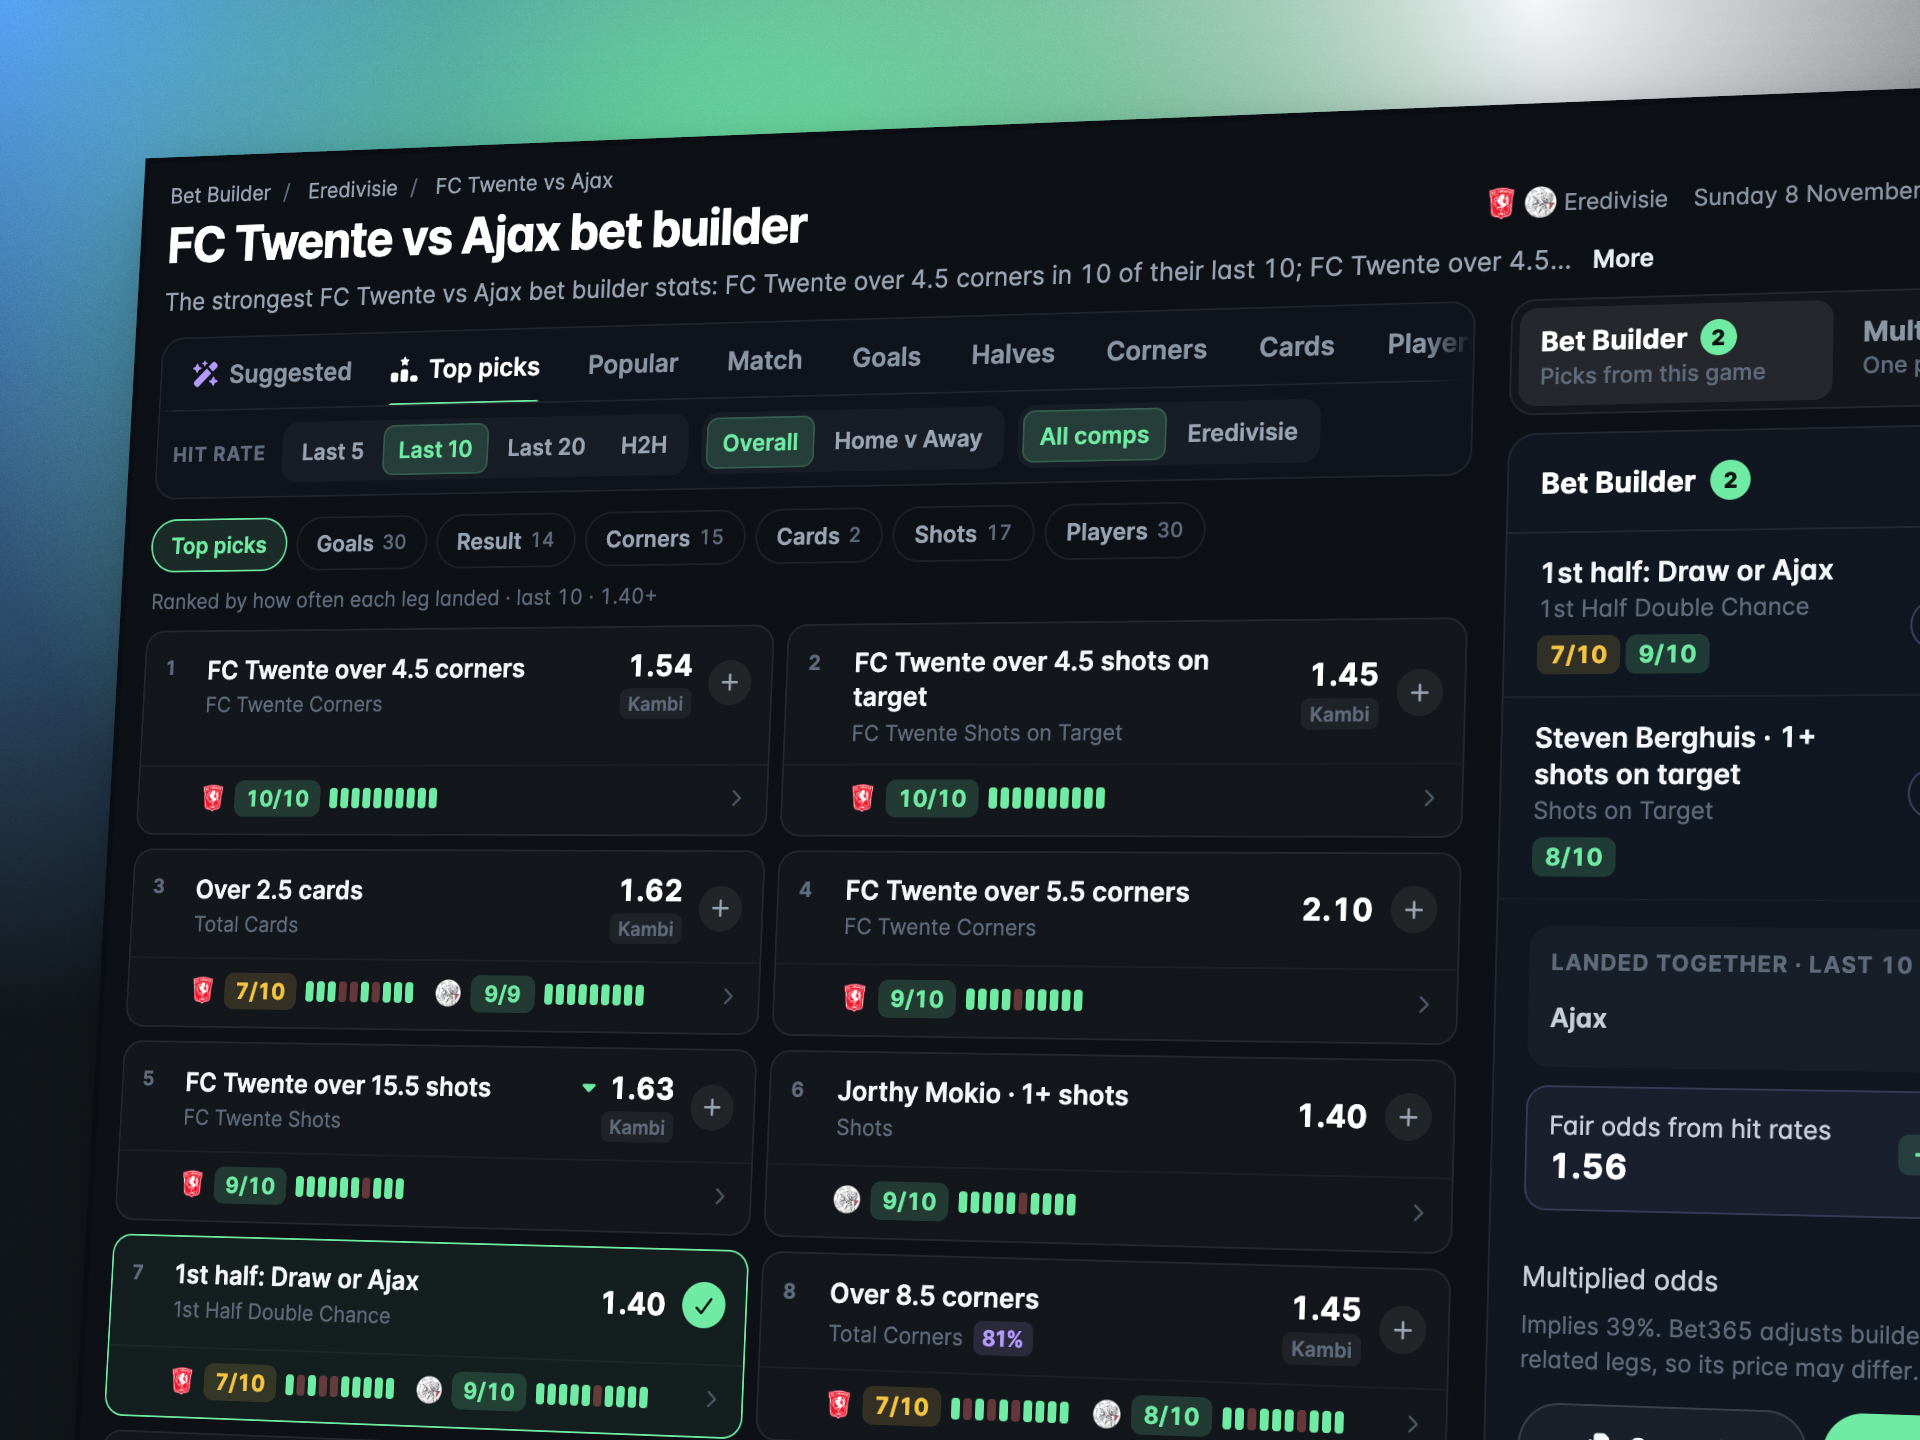
Full Trends TablesEvery fixture per market with odds, Edge vs the price, momentum, streaks & bulk alerts
Live Odds AlertsNever miss a price move — instant alerts across 1000+ leagues
Daily Value BetsBeat the bookies daily with algorithm-surfaced odds that exceed true probability
Probability ModelKnow the real odds before you bet — Bayesian predictions for every match
Correct Score PredictionsPin down exact scorelines with model-driven predictions you can filter and export
Corner PredictionsGain an edge on corner markets from O4.5 to O11.5 with data-backed predictions
Match SimulationEvery match simulated 100,000 times — scorelines, corners, cards, goal timing & handicaps
Betslip GeneratorBuild smarter accas — doubles, trebles & accumulators from probability-backed picks
Filters & BacktestingFind winning patterns with hundreds of stat combinations and verify they work
OddAlerts AI (30/Day)Get AI-powered insights on every game — pre-match and live, with 30 analyses per day
Reply to OddAlerts AIAsk follow-up questions on any analysis — dig deeper into markets, form, and pricing
In-Play FunnelSpot live value as it happens with momentum signals from shots, possession & attacks
Live Pressure MonitorSee who's truly dominating — a unique algorithm that reads the real flow of play
Dropping Odds & PinnacleFollow the sharp money — alerts on Pinnacle line movements before the market adjusts
Sports Edge BotExploit soft bookmaker mispricing when their odds offer +EV vs a sharp-market fair price
Market Availability AlertsBe first to the true opening odds — notified the moment markets land on Bet365
Referee Appointment AlertsGet an edge on cards — alerts when referees are appointed to fixtures in your leagues
Foul AlertsSpot live booking value — alerts when players commit multiple fouls without a card
Player PropsSearch 100k+ players by stats, compare with radar charts & get weekly Telegram digests
Form GuideFind form at a glance — 27+ leagues, 100+ stats, sortable tables for every market
Personal Edge DashboardFind what's working and fix what isn't — auto-generated insights from your bet history
Bet TrackingTrack every bet with auto-settling results, bankroll management & profit charts
Daily DigestStart every day informed — customised morning summary of the best fixtures at 07:30
CSV Downloads & xGExport everything — stats, alerts, xG tables and historical data for your own analysis
Presets, Planner & NotesSet once, apply everywhere — save alert configs, bulk-assign & attach notes to triggers
Odds ComparisonFind the best price instantly across 20+ bookmakers — zero affiliate interference
Discord CommunityJoin 1000+ serious bettors sharing picks, strategies & insights daily