 Sint Maarten
 French Guiana
 Haiti
 United States
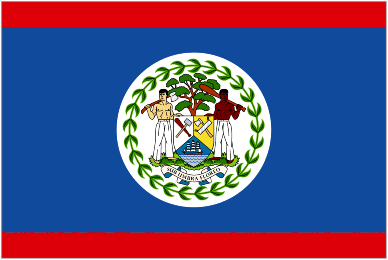 Belize
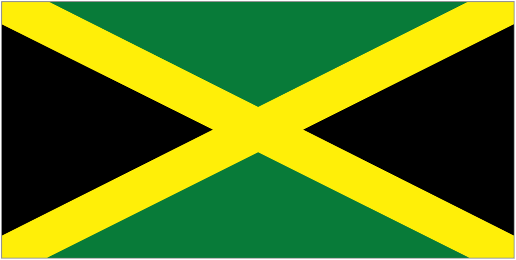 Jamaica
 Mexico
 Panama
 Guatemala
 Canada
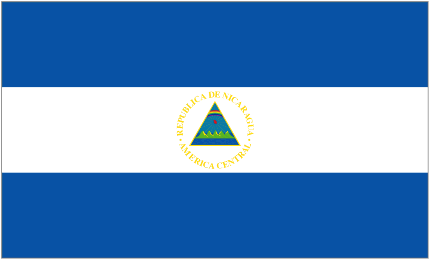 Nicaragua
 El Salvador
 Bermuda
 Dominica
Most goals scored
- Guyana 5 games 22
- Saint Martin 5 games 19
- Cuba 5 games 17
- Antigua and Barbuda 5 games 13
- Montserrat 5 games 12

 NEW
Introducing New Bet Builder Tool
4 Nov 2026
Build bet builders with the stats switched on. This new innovative tool combines the UI you are familiar with when you place bet builders a…
 BETA
VigShift Beta Now Open on OddAlerts!
30 Oct 2026
VigShift watches the sharp market on every match. When informed money hits a price and it drops fast, you get a push within a second, with …
 VIDEO
The Predictions Show: Nations League & EFL
13 Nov 2026
🗣️ No major European leagues? No problem. Join founder Joe as he looks through some of the biggest games this weekend from the Nations Leag…
 NEW
5 New Livescore Page Updates
12 Nov 2026
1. A new dropdown allowing you to jump to related or popular fixtures 2. Quickly view /simulations, and /bet-builder pages for a specific f…
NEW
Bet Builder: Nations League & EFL Trophy Added
9 Nov 2026
👉 https://www.oddalerts.com/bet-builder
No guide matches yet. Press enter to search the full text.

85 CONCACAF Nations League 2026/2027 matches played: 3.42 goals per game, 64% Over 2.5, 47% BTTS, 9.0 corners, 4.1 cards per game. Home wins 42%, draws 12%, away wins 46%. Updated 14 November 2026.
Results this season
| # | Team | P | GD | Pts |
|---|---|---|---|---|
| 1 |  Guyana |
5 | +20 | 15 |
| 2 |  Montserrat |
5 | +9 | 12 |
| 3 |  St. Vincent and the Grenadines |
4 | +8 | 12 |
| 4 |  Puerto Rico |
5 | +7 | 12 |
| 5 |  St. Lucia |
5 | +6 | 12 |
| 6 |  Cuba |
5 | +11 | 11 |
| 7 |  Curacao |
5 | +7 | 11 |
| 8 |  Barbados |
5 | +3 | 10 |
| 9 |  Aruba |
5 | +3 | 10 |
| 10 |  Saint Martin |
5 | +15 | 9 |
Totals and rates across 85 matches played in 2026/2027.
This page combines CONCACAF Nations League statistics, fixtures, results, team rankings, player data and standings, with sections shown when that data is available.
85 CONCACAF Nations League matches have been played in 2026/2027, producing 291 goals at an average of 3.42 per game.
Both teams have scored in 47% of CONCACAF Nations League matches this season, and 64% have finished with over 2.5 goals.
CONCACAF Nations League matches in 2026/2027 average 9.0 corners and 4.1 cards per game.
Home teams have won 42% of CONCACAF Nations League matches in 2026/2027, with 12% draws and 46% away wins.
Yes. Use the season selector above the page to load historical CONCACAF Nations League fixtures and statistics without changing competition.